Integrated Intelligence for
Private Credit Portfolios
Binocs is an AI enabled portfolio tracking and workflow management system. It improves operational efficiency and risk management for private credit funds through reliable data processing and advanced analytics.
Proudly backed by


Features
The most modern and secured tech stack to manage your entire workflow, so you get to focus on key decision-making.
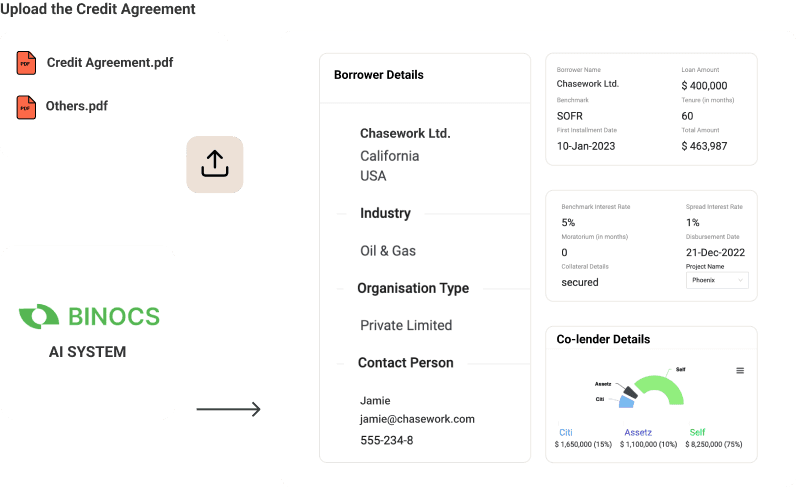
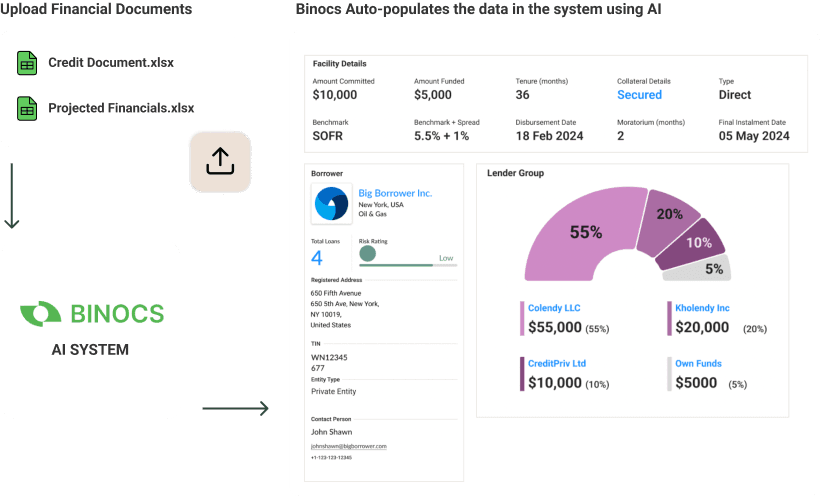
High Integrity Financial Data Extraction
The platform utilizes Artificial Intelligence (AI) to extract pertinent information from Financial Statements, presenting it in a standardized format. It accurately extracts data from Balance Sheet, Income Statement, Cashflow Statement, Notes, and Schedules and other documents, thus simplifying the analysis process. Moreover, it digitizes credit agreements, offering a calendar view of all events from disbursement and repayment dates to covenant reporting deadlines.
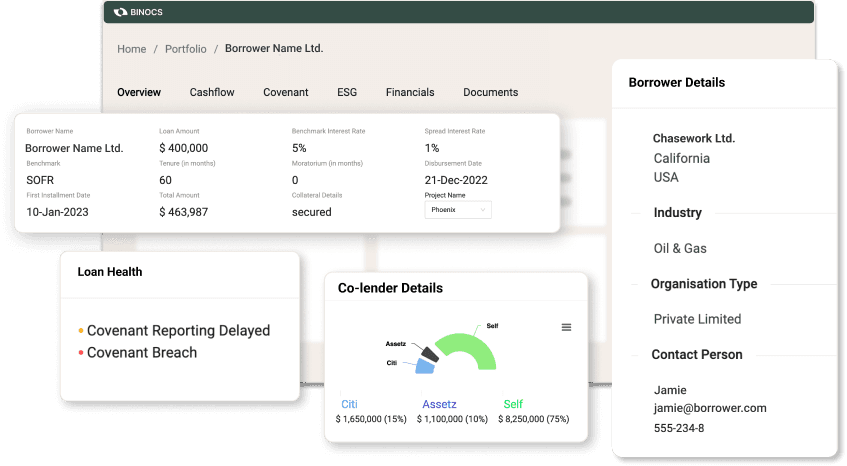
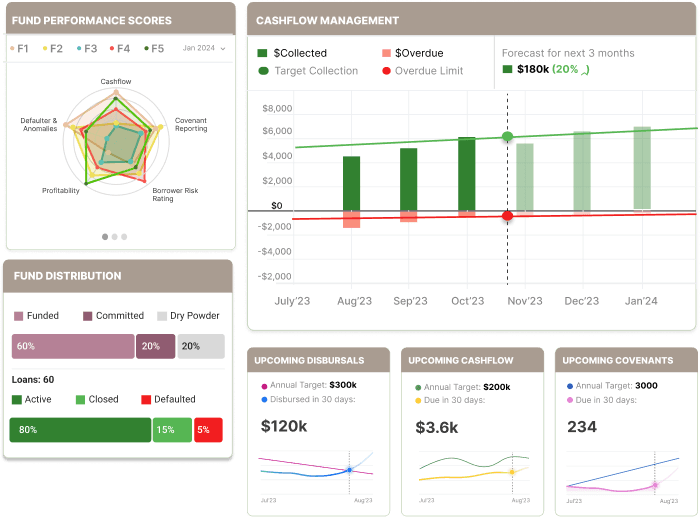
Streamlined Cashflow, Covenant & ESG Monitoring
The Binocs system monitors all repayments, covenants and ESG and sends alerts in cases of deviations. It also sends automated reminders to the counterparties for timely submissions. The system provides an actionable dashboard to manage all of these operations smoothly.
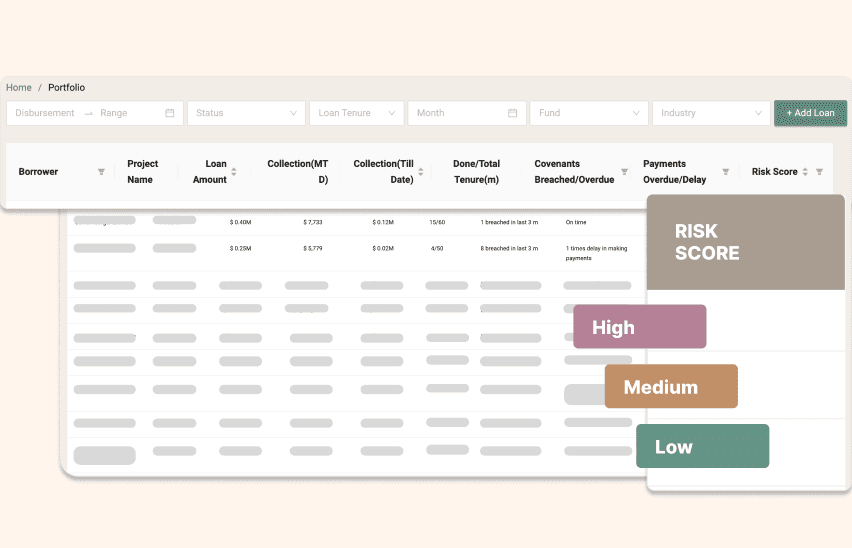
Risk Management and Early Warning System
The AI system assigns risk score of loans by factoring borrowers' financial health, credit history, and various other internal and external factors. Get early warnings about the portfolio health to take the right mitigation steps.
Automated Document Management
The system stores all documents on a single platform with multiple integrations. The system enables timely collection of these documents, digitization of relevant documents as well as maintains a searchable repository of the same along with all the meta data.
Additional Features
Automated notifications and reminders to counterparties.
Asset Managers can send timely notifications and reminders to borrowers for sending repayment and reports while maintaining all communication trails.
Integrations with market intelligence platforms and data rooms.
Integration with various third-party systems streamlines document compilation from diverse sources, thereby boosting efficiency
Calendar view of all events.
The calendar view provides a clear overview of all historical and upcoming relevant events, including disbursement and repayment dates.
Bespoke financial modeling for parameterized cash-flow projections.
We offer customization options for ratios and capital structure, ensuring precise financial analyses are aligned with your needs.
Coordinate with co-lenders for syndicated loans.
Smooth collaboration among co-lenders with centralized communication and document management. Lenders can efficiently coordinate loan syndication processes.
Central Communication for All Stakeholders
Centralized communication, workflow, and document-sharing platform between lenders, co-lenders, borrowers, agents, intermediaries, service providers, investors, and advisors.
Who we serve

Asset Managers
Administer portfolio borrowers efficiently to mitigate risk.
Lenders can track the entire loan book to make better credit decisions. Proactively monitor covenants and ESG, to ensure compliance by sending notifications and reminders to borrowers.

Borrowers
Prevent defaulting on covenants to avoid penalties.
Borrowers get a unified platform for management of all their lenders. Easily report all covenants, get early notifications and alerts to never miss a payment, and avoid significant penalties.

Service Providers
Empowering the legal and accounts team to administer the credit agreements.
Lawyers, auditors, and administrative agents can easily access and review covenant reports, and financial documents to support clients' needs with confidence.
Administer portfolio borrowers efficiently to mitigate risk.
Lenders can track the entire loan book to make better credit decisions. Proactively monitor covenants and ESG, to ensure compliance by sending notifications and reminders to borrowers.
Prevent defaulting on covenants to avoid penalties.
Borrowers get a unified platform for management of all their lenders. Easily report all covenants, get early notifications and alerts to never miss a payment, and avoid significant penalties.
Empowering the legal and accounts team to administer the credit agreements.
Lawyers, auditors, and administrative agents can easily access and review covenant reports, and financial documents to support clients' needs with confidence.